塔吉亞酒店 | 熱門塔吉亞住宿限時優惠每晚可低至 HK$611
 改變主意預訂可免費取消的酒店
 精挑細選搜尋全球近百萬間住宿
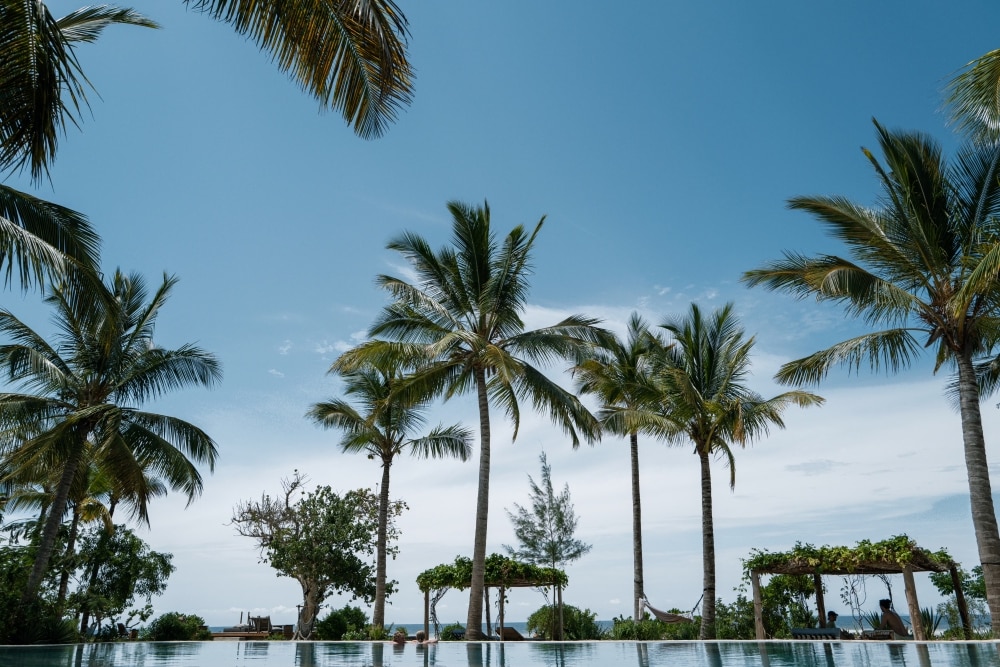
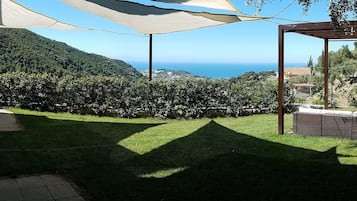
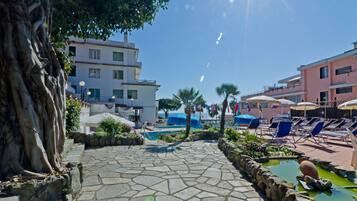
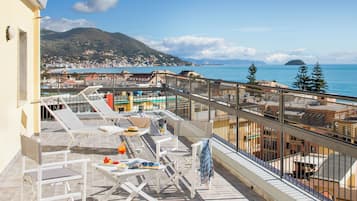
體驗非一般的塔吉亞住宿
SPA 水療中心
泳池
塔吉亞酒店熱選


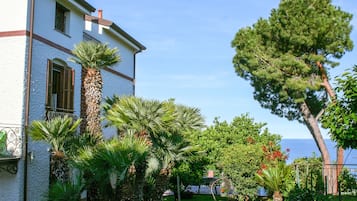
阿瑪酒店
阿瑪酒店Taggia
7.4 分 (滿分為 10 分),不錯,(164 則評價) 篇評價
「Albergo comodo, personale gentile. Parcheggi pochi ma disponibili. Aria condizionata ok, vicino al mare a meno di 10 minuti a piedi. In attesa del check in pomeridiano siamo andati in spiaggia. Colazione e bevande self service in bicchieri di carta. È stato nel complesso un bel weekend :)」

Luigina
現售 HK$774
合共 HK$869
連稅及其他費用
6 月 30 日 - 7 月 1 日


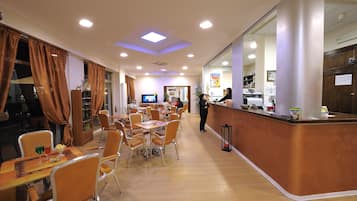
瑞士酒店
瑞士酒店Taggia
7.2 分 (滿分為 10 分),不錯,(77 則評價) 篇評價
「Great location, priceless view of the sea, staff very accommodating and helpful. Some rooms are updated and very small, some are bigger and need some TLC but I really good value for the money. Queen bed is two mattress put together with one big sheet, uncomfortable and kept falling in as I sleep in the middle, that is the only negative」

Giovanni
現售 HK$617
合共 HK$696
連稅及其他費用
6 月 25 日 - 6 月 26 日


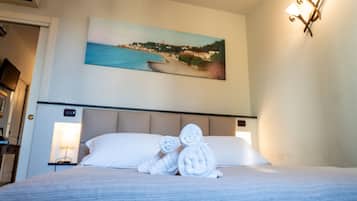
阿里斯頓蒙特卡洛酒店
阿里斯頓蒙特卡洛酒店Sanremo
8.0 分 (滿分為 10 分),很好,(281 則評價) 篇評價
「superbe vue et bel accueil」

LENNY
現售 HK$584
合共 HK$678
連稅及其他費�用
6 月 28 日 - 6 月 29 日


特雷紮迪佩拉爾格尼民宿
特雷紮迪佩拉爾格尼民宿文蒂米利亞舊城
8.4 分 (滿分為 10 分),很好,(281 則評價) 篇評價
「Far away from the train station」
Alejandro
現售 HK$887
合共 HK$1,012
連稅及其他費用
7 月 14 日 - 7 月 15 日


馬斯內德爾康福拉特酒店
馬斯內德爾康福拉特酒店Badalucco
10.0 分 (滿分為 10 分),完美,(9 則評價) 篇評價
「Nydelig hotell og restaurant i landlige omgivelser. Og for en restaurant, nydelig」

Arild D
現售 HK$1,272
合共 HK$1,399
連稅及其他費用
6 月 25 日 - 6 月 26 日


自由綠酒店
自由綠酒店Dolceacqua
9.2 分 (滿分為 10 分),卓越,(55 則評價) 篇評價
「Beautiful apartment, with lovely view.
Sauna and jacuzzi unexpected bonus.
Alot of stairs to reach entrance but well worth the effort.
Lovely shower room and great breakfast.
Would certainly recommend if visiting Dolceacqua.」

Gordon
現售 HK$925
合共 HK$1,035
連稅及其他費用
6 月 25 日 - 6 月 26 日


盧維亞酒店
盧維亞酒店曼通市中心
9.0 分 (滿分為 10 分),卓越,(36 則評價) 篇評價
「Staff were really nice and everything was neat and tidy. We found it a little hot at night under the doonah/duvet even with the aircon on, so maybe having a top sheet on the bed as well so guests can choose doonah or sheet would be perfect. Really loved our time in Menton and the hotel was a perfect location! Would definitely stay here again 😊」

Isabelle
現售 HK$924
合共 HK$1,040
連稅及其他費用
6 月 29 日 - 6 月 30 日


貝斯特韋斯特安圖利恩酒店
貝斯特韋斯特安圖利恩酒店Santo Stefano al Mare
9.0 分 (滿分為 10 分),卓越,(298 則評價) 篇評價
現售 HK$1,128
合共 HK$1,240
連稅及其他費用
6 月 25 日 - 6 月 26 日


加布里埃爾酒店 - 2025 年新開幕
加布里埃爾酒店 - 2025 年新開幕曼通市中心
10.0 分 (滿分為 10 分),完美,(111 則評價) 篇評價
「新開張的酒店装修設備樣樣嶄新,員工們服務態度熱情親善,早餐豐富好味,周圍環境安静優雅,值得推薦。」

Yui Ling
現售 HK$1,794
合共 HK$2,014
連稅及其他費用
6 月 28 日 - 6 月 29 日


過去 24 小時內找到的最低每晚價格 (2 位成人 1 晚)。價格及供應情況可能會出現變動,可能設有其他條款。

住在塔吉亞人氣景點附近
了解塔吉亞更多
歡迎探索塔吉亞—這裡的博物館和海灘正等著你體驗!


塔吉亞平價住處

卡薩澤費里諾旅館
Via Zeffiro Massa 77 Sanremo IM
6月28日 至 6月29日 價格為每晚 HK$555
HK$555
合共 HK$646
6 月 28 日 - 6 月 29 日
連稅及其他費用
9.2/10 卓越! (153 則評價)